This week was the annual Chrome Dev Summit. While it was a little different this year due to COVID, it did mean that people like me who would otherwise miss out on the activities of the two-day event got to participate.
I can’t not mention CDS Adventure - a virtual conference hall full of everyone attending. You create your own avatar and hop around talking to other attendees and Google staff about all things Chrome. It’s not the same as being there in person but a great alternative.
There’s collectible hats, too. I’m sold.

There were lots of great talks about all sorts of web-based topics. There’s quite a focus on the Chrome browser and the things it does well, but there is plenty of content applicable across the web. They’re all up on their YouTube channel and I thoroughly recommend picking out the ones that interest you and giving them a watch.
One added bonus of the conference going remote is that the workshops they run every year are now held online. I was lucky enough to get a place on their Web Performance workshop. Spread over two days, the lovely Tammy Averts and Tim Kadlec went over the basics of performance on the web, what to look out for and how to debug when things go wrong.
“Improving performance” is quite a loaded phrase. It means lots of different things, which can vary from person to person. Generally, good performance involves getting files to the client as quick as possible and providing a smooth and responsive experience once it’s there.
There are lots of benefits to improving performance. On a human level it’s more enjoyable to use a website and you’re not blocking out users on slower devices and connections from seeing your content. But from a business perspective, it’s known to increase successful conversions, boost brand loyalty and will soon even affect page rank in Google search results. There’s an argument for every angle.
Core Web Vitals
Chrome has been focusing on performance metrics for a while already. For many years we’ve been checking things like page load times, but what is a “load” anyway? So many things can affect when a load event happens such as device power, network connectivity or even just a rogue third-party script that sometimes goes down. It’s capturing too much at once.
The Chrome team’s latest push is the concept of Core Web Vitals. These are a set of three important metrics that all developers should be keeping an eye on to make sure everyone has a good experience on their site.
They come as three handy initialisms - LCP, FID and CLS.
Largest Contentful Paint (LCP)
The perceived performance of a website is very important. People will start to interact with a page as soon as they think it’s finished loading. In reality that’s when the biggest part of the initial view stops looking blank, rather than waiting for every style, font and image to finish coming down.
The LCP is the time between the initial navigation and the point the largest part of the visible viewport appeared on screen. The target is under 2.5 seconds.
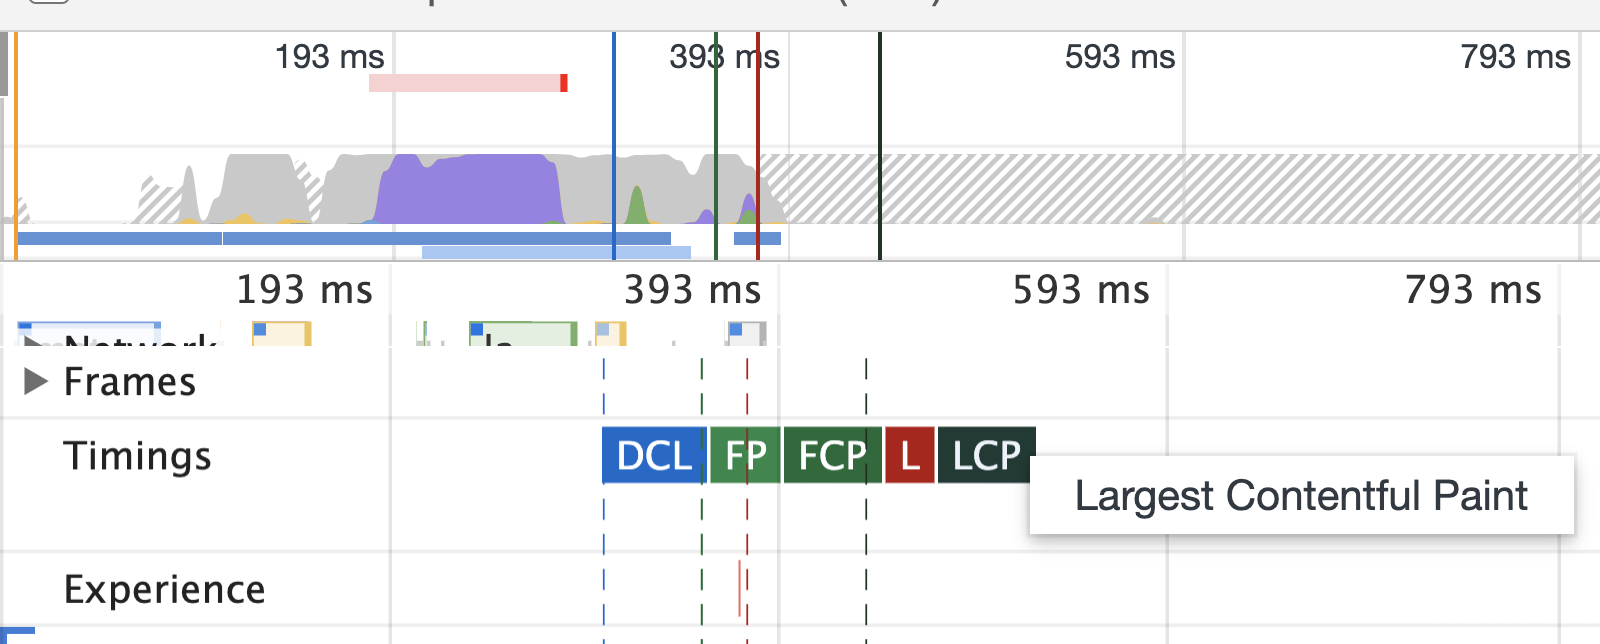
While that might sound a bit wishy-washy, tools such as Lighthouse can identify when exactly that happens. It also shows up inside Chrome’s DevTools whenever you run a performance recording.
This can be improved by removing any blocking scripts and CSS requests, deferring the load of any non-critical assets and ideally server render HTML to avoid having to wait for a JS bundle to download first. Other things can load outside the viewport without affecting this score, so make sure every download is prioritised properly.
First Input Delay (FID)
It can be quite frustrating when tapping on a text input on a lower-powered phone and not have anything change for a few seconds. Did it know I tapped it? Is it disabled? Maybe the site doesn’t work?
The FID measures the time between an interaction happening and something responding to that action occurring. Ideally, that’s less than 100 milliseconds.
A site can become unresponsive when it’s busy doing other work somewhere else. A large script or a particularly complex CSS file might take more time to work through on some devices than others. As all this work happens in the main thread any one thing can slow everything down.
To improve this do the heavy lifting away from the main thread. That can mean either serving smaller files, avoiding slow tasks on user input or moving large computations off to a separate thread.
It’s worth noting that it’s unlikely this will be an issue for many sites. For example a news article may not have any interaction at all, or if it does it happens a few minutes after everything has loaded. Using the time a user is idle while they read the page is a great time to do any long tasks.
Cumulative Layout Shift (CLS)
One of my pet peeves is when I’m reading a page and an advert has loaded slowly or some carousel content has changed, which causes all the text to move down the page. It takes a few seconds to find my place again. That’s time I’m not doing what I came to the site to do.
CLS measures how much a page shifts around within the viewport in its lifetime. Being cumulative, its recorded over the life of the page and changes as the page does. A score of 0.1 or less is ideal.
While the number may seem arbitrary, it’s impacted both by the size of the content and the distance it moved. To make this number smaller make the position of content as stable as possible, reserve space for content that loads in later and - if it’s unavoidable - have elements move about all in one go to avoid multiple hits to the score.
Testing a site
These are the three metrics you should be tracking, but how can you see that information?
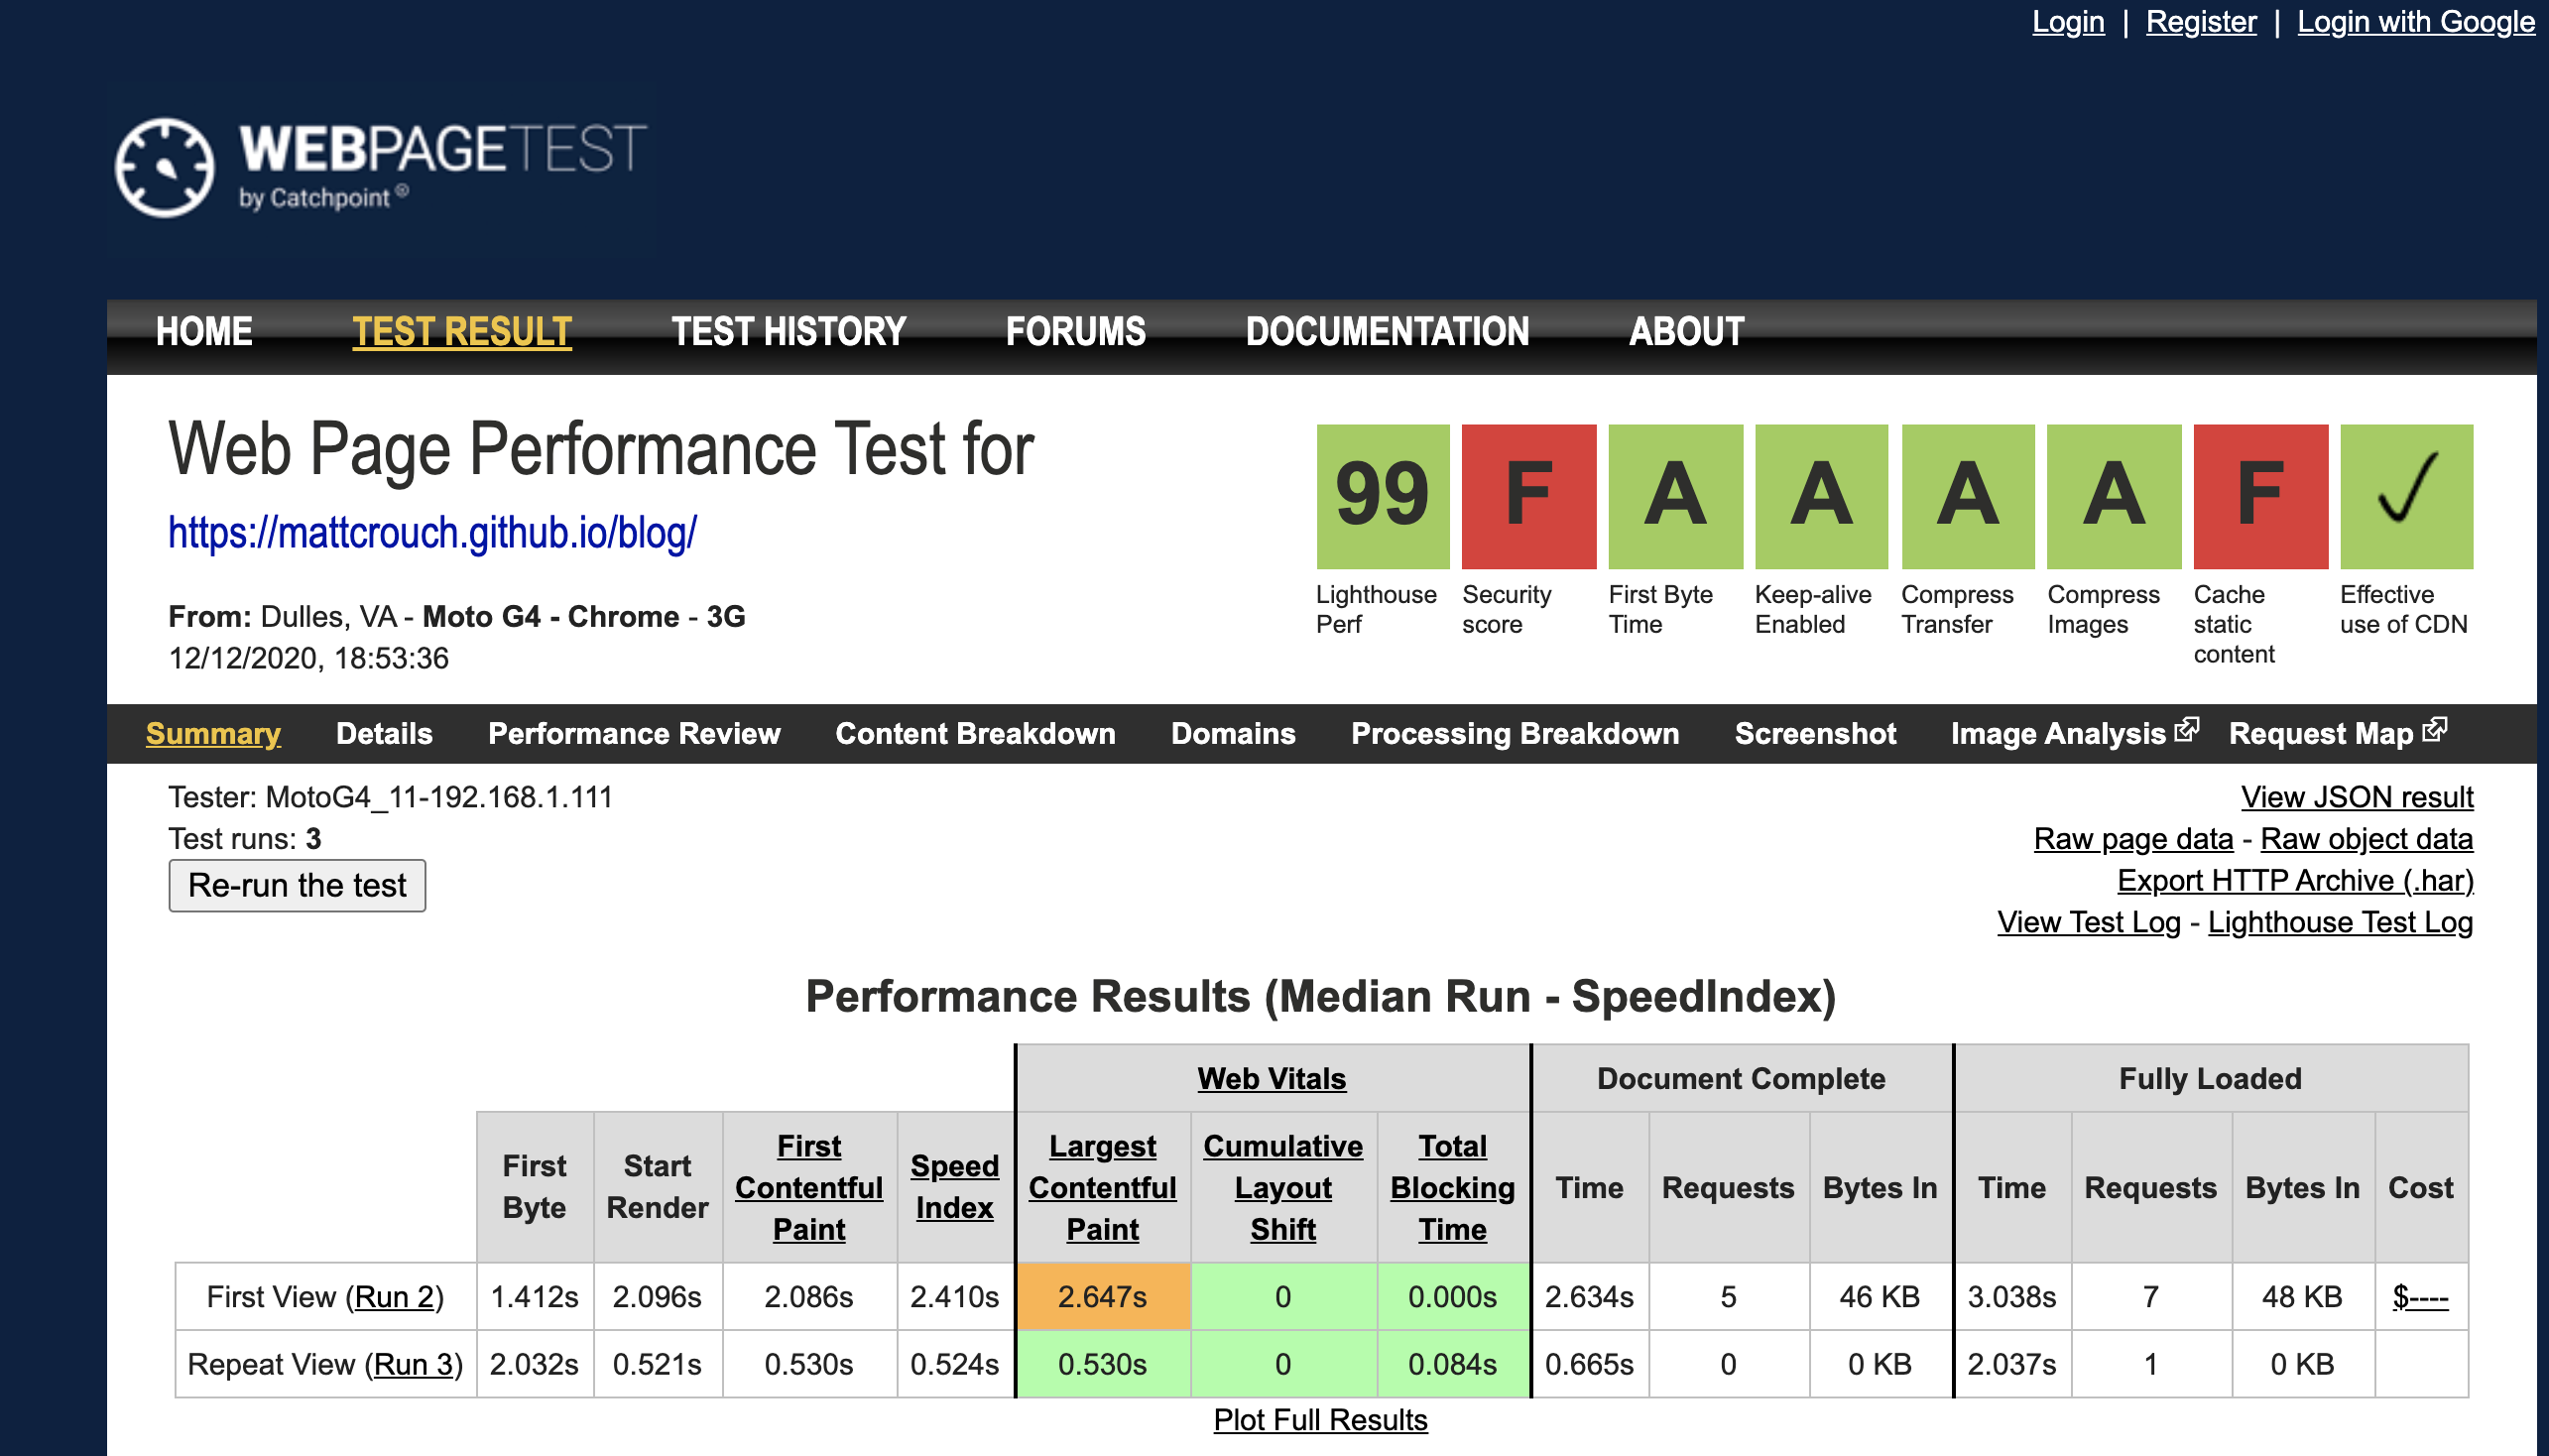
Sites like WebPageTest can give you a break down of lots of things to see what might be causing performance problems. Within that, the filmstrip view can highlight when key performance events like LCP happen and what requests may be causing it. It’s options can be overwhelming, so I would recommend the easy mode to give you some sensible defaults to kick on with.
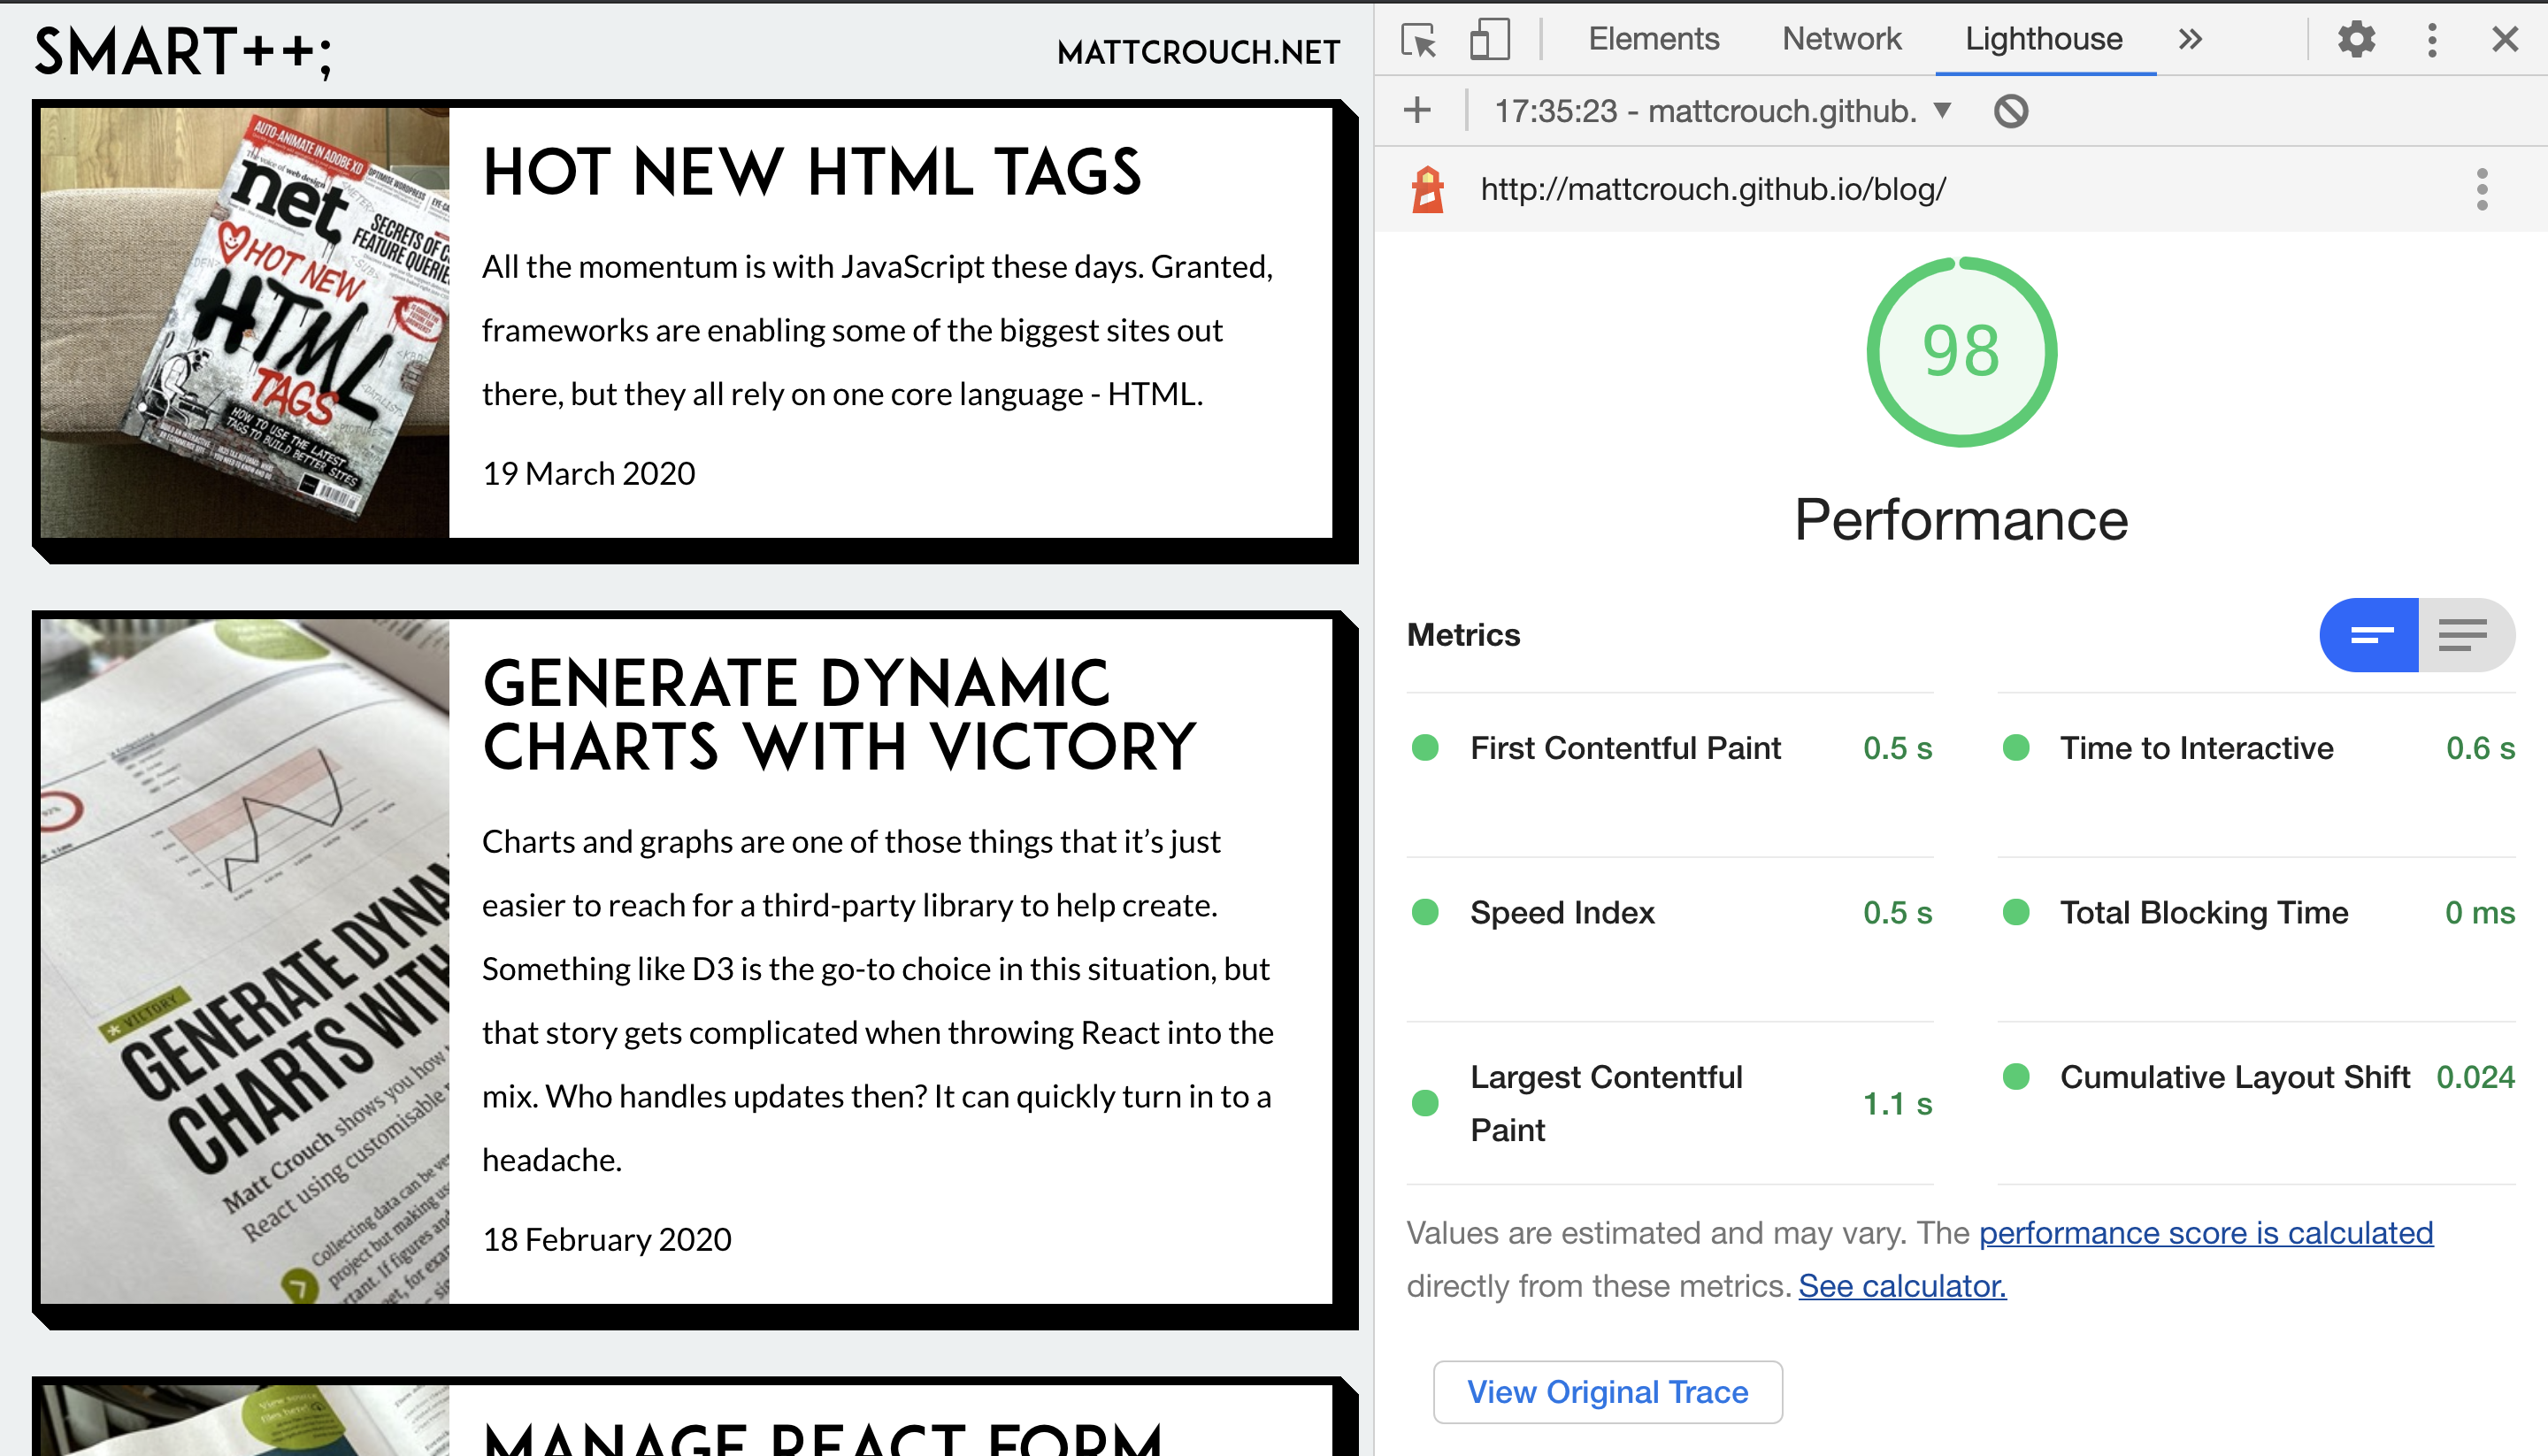
WebPageTest operates on real-world devices and will give you realistic numbers to work with, but tests can take a while to come through. To get a rough idea of how a site’s doing, Lighthouse can run in Chrome to give you feedback straight away. This is only on the local machine and while Chrome can simulate lower-powered devices or slower connections, it’s never going to be the same as what happens in the real world.
Keep an eye out
The worst issues are the ones you don’t know about until it’s too late. By finding out where those problems are it’s possible to form a plan of attack and build a site-wide approach to make sure they don’t creep back in.
These metrics should be checked after every release. It’s then easier to identify what might be causing these scores to worsen.
Finally, by having the site’s performance as a small set of metrics to track it makes it easier for those further away from the day-to-day code to see how a site’s performing. By explaining the benefits a better score brings to a site, it’s easier to get more people invested in how well the site’s working.
Performance improvements require everyone to be on board. By taking small steps everyone can start benefitting.